
KampányMűvek / 19 September 2026
Lighthouse reports in the Workshop without turning the UI into a report parser
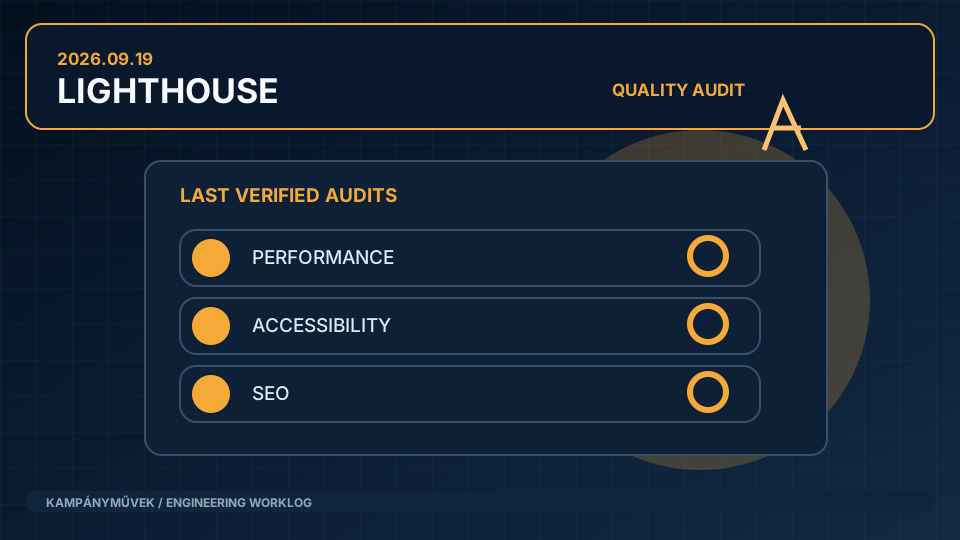
The latest Lighthouse audit for each managed website became visible in the Workshop while GitHub Actions discovery and status interpretation remained the Engine's responsibility.
Situation
Lighthouse audits were already part of the quality pipeline, yet everyday users could not easily tell when the latest audit ran or what it reported for a particular site. The native application needed to present the state, not reimplement GitHub workflow behavior or Lighthouse JSON parsing in a second technology stack.
Approach
We introduced site-oriented CLI reporting commands that find the latest audit and normalize scores, timestamps and failure states. The Workshop turns those responses into summary cards, detail views and clear errors. We also fixed real integration drift: a GitHub CLI timestamp field differed from the assumed contract, and redirects needed to preserve the originally requested Lighthouse routes.
Outcome
Performance, accessibility, best practices and SEO results can be reviewed through the native interface while still using the same underlying interpretation as the CLI and QA pipeline. Regression coverage now guards the GitHub field contract and redirect handling.